News   Nov 29, 2024
 915     0 
News   Nov 29, 2024
 361     0 
News   Nov 29, 2024
 676     1 

TTC: Complete Subway Station Ridership Figures

There's a little project I'm working on and want to to confirm that the most recent number for Sheppard 45,859 is representative of the daily Sheppard Subway ridership.

I'm going to disprove some myths.
 
There's a little project I'm working on and want to to confirm that the most recent number for Sheppard 45,859 is representative of the daily Sheppard Subway ridership.

I'm going to disprove some myths.
The fine print on the ridership list does read: "This table shows the typical number of customer-trips made on each subway on an average weekday (in bold text), and the typical number of customers travelling to and from each station platform on an average weekday."
 
Great. While I did some research to see how Sheppard ranks, I think I'll go with a per-kilometre ridership.

But so far I can say Sheppard blows Cleveland's entire rail transit network out of the water.
 
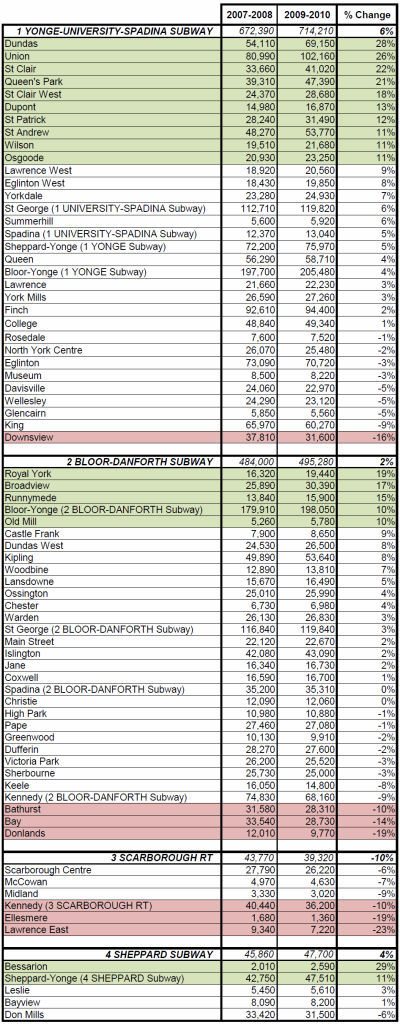
I somehow found that the TTC has posted more recent subway station ridership figures for 2009-2010.

I played around in Excel a bit and compared them to the 2007-2008 stats. Things I noticed:
  • the University line saw major growth from Union to Queen's Park
  • St Clair and St Clair West rebounding from LRT construction
  • Bessarion was the biggest gainer, up to a whopping 2600 per day.
  • King down quite a bit - bank layoffs?
  • Royal York, Runnymede, Old Mill all up. Not sure why.
  • Downsview down 16%. I have no idea why, and I'm not too sure what this says about the subway extension. The York strike ended Jan 2009 - surely that wouldn't have had that big an affect on these numbers.

TTC.png
 
It's difficult not to question the accuracy of this data with such odd swings.
King down 9%... St.Andrew up 11%.
I assume the sample method is the people with counters who sometimes sit for a few days outside a subway station. That is highly impacted by seasonal swings. I hope they account for that.

EDIT: Could the drop at Downsview and Don Mills be from the Viva strike?
 
Last edited:
Thanks for this. The Dundas and St. Patrick's station increases might be related to the reconstruction of the Dundas streetcar tracks (which probably under-valued the 2008-2009 figures) similar to College/Queen's Park in the previous year's comparison charts.

It is disappointing to see Museum's numbers decrease after the renovation, or do I have my timing wrong on this one?
 
Yeah, the year by year changes are heavily tweaked by erroneous counting, natural variation, etc. It's better to look at a multi-year period. The University line's figures were perhaps static for a few years and only now updated, 'causing' huge increases. Perhaps there was a blizzard the day they counted at Downsview or the SRT, or they did it on a day when few students were going to school, like in June or December (both are heavily used by post-secondary students). Obviously, they can't count every station at the same time, on the same day as last year, and all in perfect conditions. Collectors fall asleep or leave the gates open and wander off, people flash their Metropasses, etc. Someone standing there clicking a counter may stop and chat to a lost traveller or harass some loiterers. Union, in particular, seems to have been flat for too long and this number seems more realistic...many bus routes are listed with identical riderships year after year. Makes you wonder if some of these counts are estimated.

I wonder what an acceptable level of fluctuation is...10%? 50,000 one day could be 42,000 or 53,000 the next day and that could be totally normal. A graph-savvy person might reap interesting results if they used several years of data...

Bessarion will almost undoubtedly lead in percentage growth over the next decade as ParkPlace is built. The only competition would be Ellesmere, if the York Mills bus made a real connection to the station.
 
It's difficult not to question the accuracy of this data with such odd swings.
King down 9%... St.Andrew up 11%.
I assume the sample method is the people with counters who sometimes sit for a few days outside a subway station. That is highly impacted by seasonal swings. I hope they account for that.

These numbers are weekday averages for entire year, so I don't see how seasonal variations woudl affect it.
 
I would expect the ridership of stations, other than transfer stations and stations where a guy sits in a chair next to an open door, to be fairly accurate considering the existence of turnstiles. Don't the turnstiles have counters?
 

Back
Top